Google Classroom
Google Classroom
GeoGebra
GeoGebra Classroom
Sign in
Search
Google Classroom
Google Classroom
GeoGebra
GeoGebra Classroom
Outline
Algebra 1
Statistics
Solving Linear Functions and Inequalities
Graphing Linear Functions
Writing Linear Functions
Algebra 1
Author:
Thomas Gebbie
Topic:
Algebra
Table of Contents
Statistics
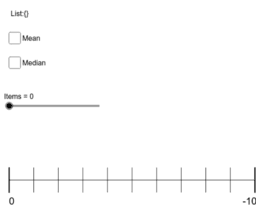
Dot Plot Generator
Box and Whisker Practice #2
Compare Box and Whisker Plots
Solving Linear Functions and Inequalities
Algebraic Proof Justification 1
Algebraic Proof Justification 2
Literal Equations Proof Justification
Graphing Linear Functions
Investigate the relationship between the three forms of line
First, use the sliders to create the parent function, y = x.
DIGI203-3D #8
Writing Linear Functions
Point Slope Form Matching
Slope Intercept Form Matching
Equivalent Linear Equations Matching
Next
Dot Plot Generator
New Resources
¿Quién llegará más lejos en el mundial?
bewijs stelling van Pythagoras
Slope and Road Signs
Cartesian vs Polar
Nikmati Keunggulan Di Bandar Judi Terpercaya
Discover Resources
pythagorean theorem
Metatrons Cube - Octahedron
limits-example
Basic Grapher
The Chord Between Intersecting Circles
Area of a function defined parametric
Discover Topics
Upper and Lower Sum or Riemann Sum
Means
Standard Deviation
Incircle or Inscribed Circle
Ratios