Google Classroom
Google Classroom
GeoGebra
Classe GeoGebra
Se connecter
Chercher
Google Classroom
Google Classroom
GeoGebra
Classe GeoGebra
Contenu
S2,3,5 Statistics
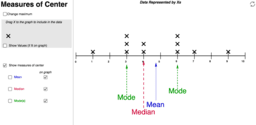
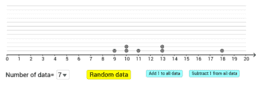
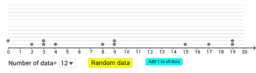
Measures of Center - Dot Plot
Measures of Central Tendency 集中趨勢的量度
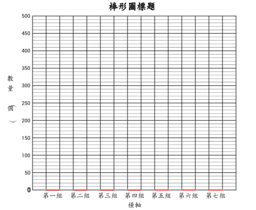
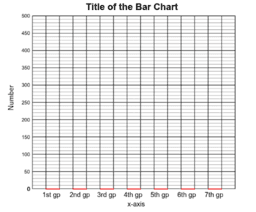
棒形圖製作器
Bar Chart Plotter
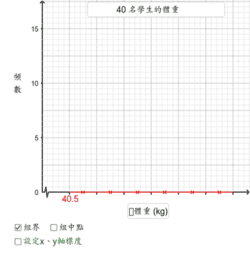
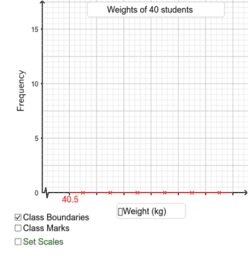
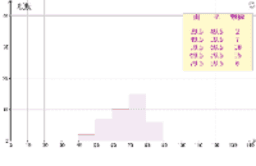
製作組織圖
Drawing Histograms
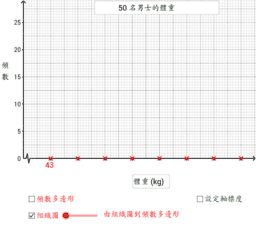
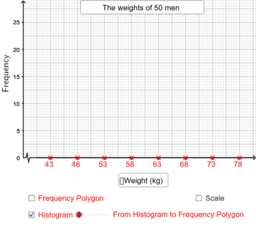
由組織圖到頻數多邊形
From Histograms to Frequency Polygons
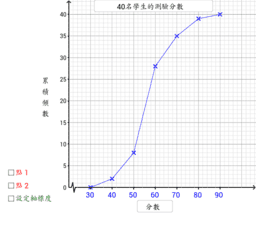
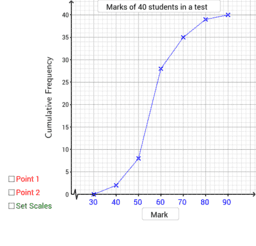
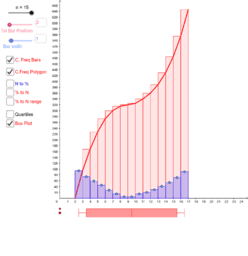
累積頻數多邊形的應用
Cumulative Frequency Polygon
累積頻數多邊形
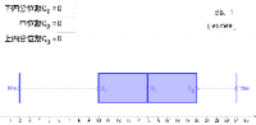
Quartiles and Box Plot (one data set) 四分位數與框線圖(一組數據)
Quartiles and Box Plot (two data sets) 四分位數與框線圖(比較兩組數據)
Quiz on Quartiles and Box Plot 四分位數與框線圖:測驗
Cumulative Frequency Properties
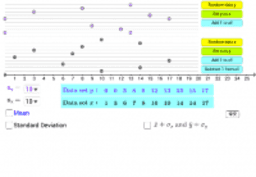
Standard Deviation (two data sets) 標準差(比較兩組數據)
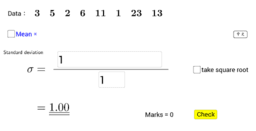
標準差:測驗
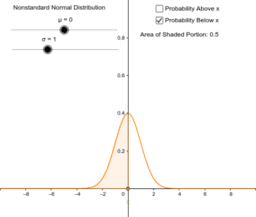
Standardizing the Normal Distribution
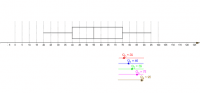
Box and Whisker plot
S2,3,5 Statistics
Auteur :
tkyggb
Thème :
Histogramme
,
Statistiques
S2 Statistics, Histogram, Frequency Polygon, Frequency Curve, Cumulative Frrequency
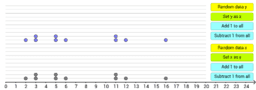
Measures of Center - Dot Plot
Measures of Central Tendency 集中趨勢的量度
棒形圖製作器
Bar Chart Plotter
製作組織圖
Drawing Histograms
由組織圖到頻數多邊形
From Histograms to Frequency Polygons
累積頻數多邊形的應用
Cumulative Frequency Polygon
累積頻數多邊形
Quartiles and Box Plot (one data set) 四分位數與框線圖(一組數據)
Quartiles and Box Plot (two data sets) 四分位數與框線圖(比較兩組數據)
Quiz on Quartiles and Box Plot 四分位數與框線圖:測驗
Cumulative Frequency Properties
Standard Deviation (two data sets) 標準差(比較兩組數據)
標準差:測驗
Standardizing the Normal Distribution
Box and Whisker plot
Suivant
Measures of Center - Dot Plot
Nouvelles ressources
sanjiaohanshu
畫出對稱圖形
拼砌四邊形
第八周作业
Fibonacci Clock
Découvrir des ressources
為甚麼二次函數中,a是正數,開口向上?
繡曲線
Angle at Centre and Angle at circumference
科赫雪花動態版 (Koch Snowflake)
三角形的四心-五線-內外二圓的副本
Découvrir des Thèmes
Périmètre
Transformations Géométriques
Fonctions Polynomiales
Volume
Losange