Google Classroom
Google Classroom
GeoGebra
GeoGebra Kennslustofan
Innskráning
Leit
Google Classroom
Google Classroom
GeoGebra
GeoGebra Kennslustofan
Útlína
Estatística
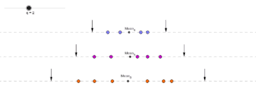
Statistical Outliers Impossible in Small Samples
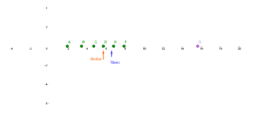
Outlier Influence
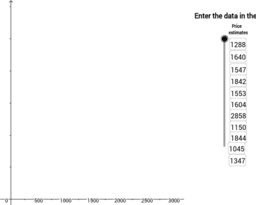
Estimate using Box Plot
Outliers
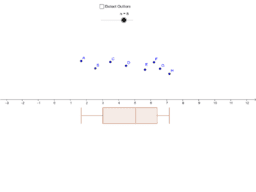
Dynamic Boxplot
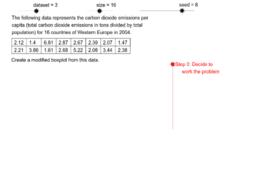
Step Through Modified Boxplot Construction
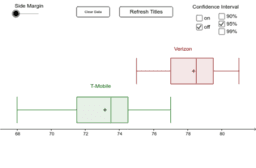
Generate Two Boxplots
Boxplot Game
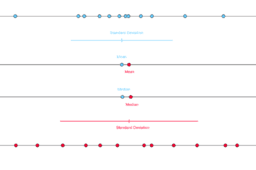
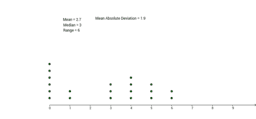
Mean, Median, and Standard Deviation
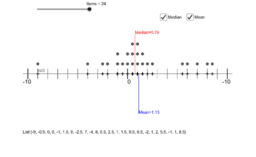
Dot Plot Interactive
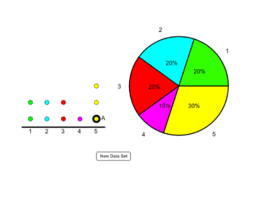
AQR Section 16: Creating a Pie Chart From a Dot Plot
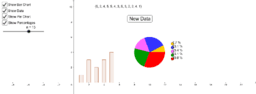
Bar Charts and Pie Charts
Dot Plot Tool
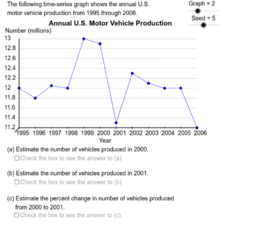
Time Series Analysis Problems
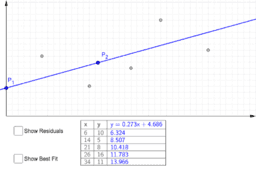
Least Squares Demonstration
Estatística
Höfundur:
Palmerim
Statistical Outliers Impossible in Small Samples
Outlier Influence
Estimate using Box Plot
Outliers
Dynamic Boxplot
Step Through Modified Boxplot Construction
Generate Two Boxplots
Boxplot Game
Mean, Median, and Standard Deviation
Dot Plot Interactive
AQR Section 16: Creating a Pie Chart From a Dot Plot
Bar Charts and Pie Charts
Dot Plot Tool
Time Series Analysis Problems
Least Squares Demonstration
Næst
Statistical Outliers Impossible in Small Samples
Nýtt námsefni
CUBO
Transformação Cubo Dodecaedro
Octaedro
Transposição didática- Caso do Teorema de Pitágoras
Como fazer um gráfico numa região delimitada do GeoGebra
Skoðaðu námsefni
Triângulo
Sombras no quadrado
Função polinomial
NC - Ficha 35 - Maria Esther - 9E
GGBRA: As Estações do Ano
Skoðaðu umfjöllunarefni
Keilusnið
Flatarmál
Hornafræði
Vigrar
Stærðfræði