Google Classroom
Google Classroom
GeoGebra
GeoGebra Classroom
Anmelden
Suche
Google Classroom
Google Classroom
GeoGebra
GeoGebra Classroom
Kapitel
Quadratics
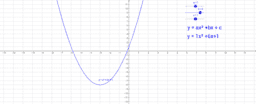
Graph y=x^2 + c
Quadratics
Autor:
Jean Maxstadt
Explore how the values of a, b, and c affect the graph.
Graph y=x^2 + c
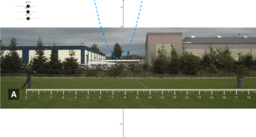
Ball in Can - Photo A
Explore how the values of a, b and c affect quadratic graph
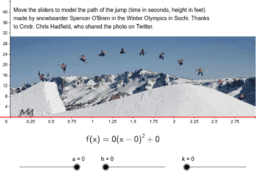
Olympic Quadratic Modeling with Sliders
Weiter
Ball in Can - Photo A
Neue Materialien
Rose Curve
Fourier Lissajous (Mechanical)
רישום חופשי
အခြေခံ data အခေါ်အဝေါ်များ
¿Quién llegará más lejos en el mundial?
Entdecke Materialien
Triangle Angle-Sum Theorem
GER - Τριγωνομετρική συνάρτηση
Proof of Prop 5 (Feb. 6, 2020)
Perpendicular Bisector Definition
Entdecke weitere Themen
Konfidenzintervall
Zufallsexperimente
Verhältnisse
Bestimmtes Integral
Zylinder