Google Classroom
Google Classroom
GeoGebra
Tarefa
Entrar no sistema
Pesquisar
Google Classroom
Google Classroom
GeoGebra
Tarefa
Esboço
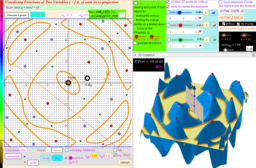
Contour Plots
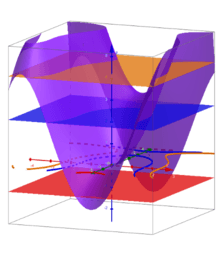
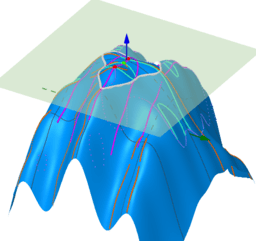
Contour plot and surface
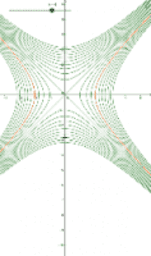
Function of several variables: several level curves
sin(x*y)+sin(x^2+y^2)- Images to Visualizing Functions of Two Variables
Visualizing Functions of Two Variables. Version 3
Contour Plots
Autor:
Edward Wicks
Contour plot and surface
Function of several variables: several level curves
sin(x*y)+sin(x^2+y^2)- Images to Visualizing Functions of Two Variables
Visualizing Functions of Two Variables. Version 3
Próximo
Contour plot and surface
Novos Materiais
Building Triangles with Set Areas
Untitled
Rolling an Equilateral Triangle
Building Trapezoids with Set Areas
Conway Circle Theorem
Descobrir recursos
Wrong Feuerbach #2
Trigonometric Ratios(三角比)
صفات متوازي الأضلاع
Patterns
Explorar Tópicos
Interseção
Média Aritmética
Probabilidade Condicional
Sólidos ou formas 3D
Probabilidade