Google Classroom
Google Classroom
GeoGebra
GeoGebra Classroom
Anmelden
Suche
Google Classroom
Google Classroom
GeoGebra
GeoGebra Classroom
Kapitel
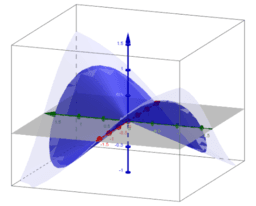
Visualization of limits of functions of two variables
Introduction
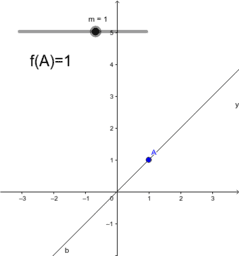
Example 1
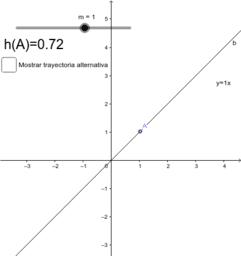
Example 2
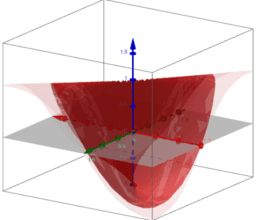
Example 3
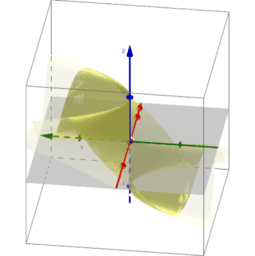
Polar coordinates: Example 1
Polar coordinates: Example 2
Polar coordinates: Example 3
Thank you very much
Visualization of limits of functions of two variables
Autor:
Laura del Río
Thema:
Funktionen
,
Grenzwert oder Limes
Presentation for sharing at the GeoGebra Global Gathering 2017
Introduction
Example 1
Example 2
Example 3
Polar coordinates: Example 1
Polar coordinates: Example 2
Polar coordinates: Example 3
Thank you very much
Weiter
Introduction
Neue Materialien
Slope and Road Signs
Nikmati Keunggulan Di Bandar Judi Terpercaya
bewijs stelling van Pythagoras
Model sferyczny - dwunastościan-dwudziestościan
Cartesian vs Polar
Entdecke Materialien
Hitta rätt i trigonometrin
T_2 Grid
Cirkels in 3D
Cube 5-Compound
Coordinate Rules for Reflections
Entdecke weitere Themen
Hypergeometrische Verteilung
Trapez
Konstruktionen
Logik oder Logikrätsel
Geometrie