Google Classroom
Google Classroom
GeoGebra
GeoGebra Classroom
Abrir sesión
Buscar
Google Classroom
Google Classroom
GeoGebra
GeoGebra Classroom
Esquema
Statistics
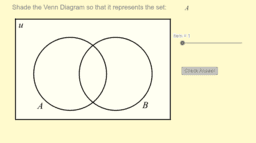
Sets and Venn Diagrams (2 Sets)
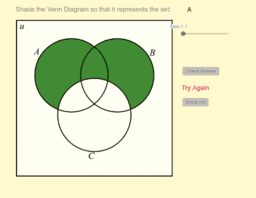
Venn Diagram (3 Sets)
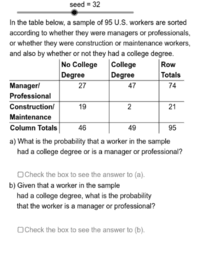
Computing Probabilities from Tables
Statistics
Autor:
Kevin Moore
Sets and Venn Diagrams (2 Sets)
Venn Diagram (3 Sets)
Computing Probabilities from Tables
Siguiente
Sets and Venn Diagrams (2 Sets)
Nuevos recursos
Slope Between 2 Points (Phase 2)
Parallelogram Anatomy
Rolling an Equilateral Triangle
Pathway to Proof: Triangle Angles
גיליון אלקטרוני להעלאת נתוני בעיה ויצירת גרף בהתאם
Descubrir recursos
Centre of a Triangle
Zsave test
Loanable Funds
Modul_15_B1_SITI HOMSIYAH_SMAN 1 KWANYAR_BANGKALAN
Creating Equations (1)
Descubre temas
Diagrama de cajas
Vectores 2D (dos dimensiones)
Construcciones
Histograma
Intervalo de Confianza