Google Classroom
Google Classroom
GeoGebra
GeoGebra Classroom
Anmelden
Suche
Google Classroom
Google Classroom
GeoGebra
GeoGebra Classroom
Kapitel
Grafieken van tweedegraadsfuncties
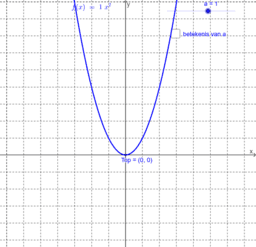
Grafiek van f(x)=ax²
Grafiek van f(x)=a(x - p)²+q
Grafieken van tweedegraadsfuncties
Autor:
Sabine Van Keer
Thema:
Funktionen
,
Graph
Invloed van de parameters op de grafiek van een tweedegraadsfunctie.
Inhaltsverzeichnis
Grafiek van f(x)=ax²
Invloed van a
De waarde van a aflezen uit de grafiek
Grafiek van f(x)=a(x - p)²+q
Grafiek van functies f(x) = a (x-p)²
Grafiek van f(x)=ax²+q
Grafiek van functies f(x)=a(x-p)²+q
Weiter
Invloed van a
Neue Materialien
van twaalfvlak tot ster
symmetrie
leid verloop af uit de grafiek
van complexiteit naar ornamentiek
Yusif ibn Kuseyir mausoleum - paneel boven ingang
Entdecke Materialien
oef_2get_7veel_del7
oef_2get_geh_co7
De inhoud van een piramide
Aquariumbokaal
rekenen met kansen
Entdecke weitere Themen
Schnittmenge
Parabel
Differentialrechnung
Höhenschnittpunkt
Histogramm