Google Classroom
Google Classroom
GeoGebra
GeoGebra Classroom
Sign in
Search
Google Classroom
Google Classroom
GeoGebra
GeoGebra Classroom
Outline
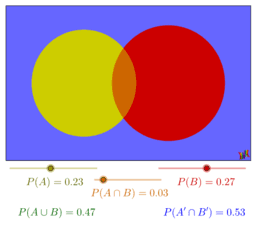
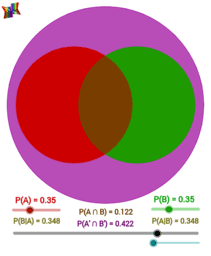
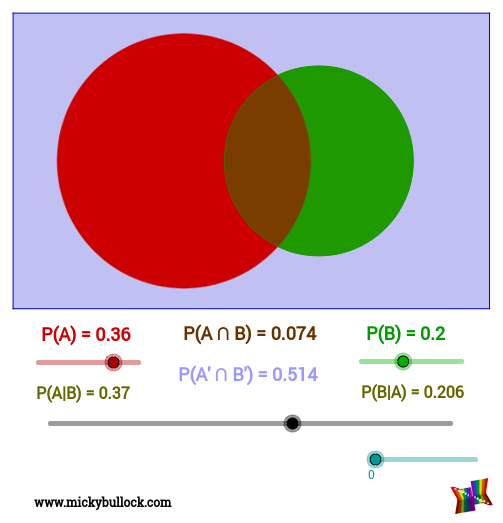
Probability Venn Diagrams
Probability Venn Diagram
Probability Venn Diagram: Circle
Probability Venn Diagram: Rectangle
Probability Venn Diagrams
Author:
Micky Bullock
Topic:
Diagrams
,
Probability
Probability Venn Diagram
Probability Venn Diagram: Circle
Probability Venn Diagram: Rectangle
Next
Probability Venn Diagram
New Resources
bewijs stelling van Pythagoras
Parallelogram Anatomy
Pathway to Proof: Triangle Angles
Building Figures with Set Areas
functionartculture
Discover Resources
สื่อการสอนเรื่องเวลา
Opener - Fraction of Area
กราฟของสมการเชิงเส้น
Intersecting Lines 2 cms
Discover Topics
Trapezium
Functions
Linear Equations
Combinatorics
Cylinder