Google Classroom
Google Classroom
GeoGebra
GeoGebra Classroom
Anmelden
Suche
Google Classroom
Google Classroom
GeoGebra
GeoGebra Classroom
Kapitel
M5: 14 Daten
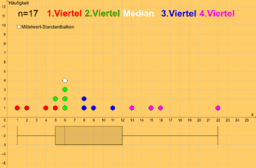
Boxplot: Datenaufteilung in Farbe
M5: 14 Daten
Autor:
Matthias Hornof
Boxplot: Datenaufteilung in Farbe
Weiter
Boxplot: Datenaufteilung in Farbe
Neue Materialien
Konstruieren das Inverse eines Punktes mit einem Zirkel
Die drei Gesichter der homogen linearen Funktion (Wertetabelle, Funktionsgleichung, Graph)
Ordne zu! - Funktionen und Steigung
Match it! Graph & Term
Oberfläche einer Kugel
Entdecke Materialien
HAK Trigonometrie, 2.JG
Großer Wagen und Polarstern
Werte
Sin Cos Abwicklung EH Kreis
Beliebiges Dreieck 7A
Entdecke weitere Themen
Kugel
Varianz
Transformationen oder Abbildungen
Graph
Winkel