Google Classroom
Google Classroom
GeoGebra
Aula GeoGebra
Valideu-vos
Cerca
Google Classroom
Google Classroom
GeoGebra
Aula GeoGebra
Esbós
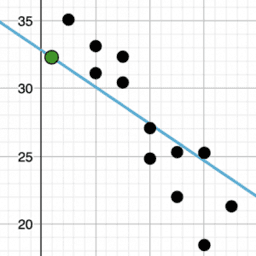
Describing Trends in Scatter Plots
Spot the Odd One out
Some more Practice
Describing Trends in Scatter Plots
Autor:
Lee McCulloch-James
,
IM 6 – 8 Math
,
GeoGebra Classroom Activities
Describing Trends in Scatter Plots Resources[/url] and Illustrative Mathematics. Licensed under the
Creative Commons Attribution 4.0 license
.
Taula de continguts
Spot the Odd One out
Describing Trends in Scatter Plots
Some more Practice
Describing Trends in Scatter Plots
Següent
Describing Trends in Scatter Plots
Nous materials
Model sferyczny - sześcian-ośmiościan
Trefoil Knot
Nikmati Keunggulan Di Bandar Judi Terpercaya
Damped Trochoidal Curve
အခြေခံ data အခေါ်အဝေါ်များ
Descobriu materials
Vertical Angles
Transformations
Pythagorean Theorem
Mullins Tesalation
Kopia av Mandelbrot Painter
Descobriu Temes
Distribució Normal
Rectangle
Cilindre
Números
Càlcul Integral