Google Classroom
Google Classroom
GeoGebra
GeoGebra Lesson
Sign in
Search
Google Classroom
Google Classroom
GeoGebra
GeoGebra Lesson
Outline
Intro to Stats
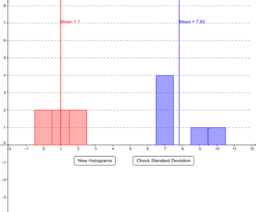
AQR Section 17: Which Histogram has more Variation?
Histograms, mean and standard deviation
Intro to Stats
Author:
Ms. Melanie Kachinsky
AQR Section 17: Which Histogram has more Variation?
Histograms, mean and standard deviation
Next
AQR Section 17: Which Histogram has more Variation?
New Resources
Linear Combination of Vectors
Function Art 3D - Flower
Angle Addition Postulate (V2) - Integer Solutions
Squaring a Rectangle (PST Version)
繪畫垂直線
Discover Resources
Cubic Function
Circles in Circles Vasarely inspired
การลบจำนวนเต็ม
Slope Field Generator
Dale A1.FIF.7 Introduction to Exponential Growth & Decay (Illustrated Meaning)
Discover Topics
Incircle or Inscribed Circle
Scalene Triangles
Tree Diagrams
Arithmetic Mean
Unit Circle