Google Classroom
Google Classroom
GeoGebra
GeoGebra Ders
Giriş yap
Ara
Google Classroom
Google Classroom
GeoGebra
GeoGebra Ders
Bölüm taslağı
SUNY - Stats
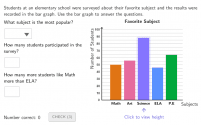
Interpreting Bar Graphs
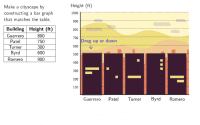
Exploring a Cityscape Bar Graph
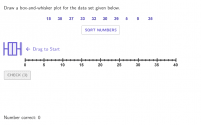
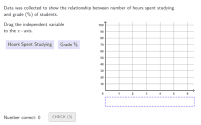
Creating Line Plots
Drawing Box-and-Whisker Plots
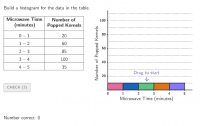
Creating Histograms from a Data Table About a Popcorn Party
Creating Scatter Plots
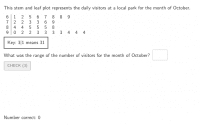
Interpreting Stem and Leaf Plots
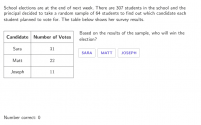
Predicting Population Trends Based on a Sample Population
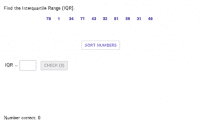
Finding the Interquartile Range
Interpreting Two-Way Tables
SUNY - Stats
Yazar:
MrValencia24
Interpreting Bar Graphs
Exploring a Cityscape Bar Graph
Creating Line Plots
Drawing Box-and-Whisker Plots
Creating Histograms from a Data Table About a Popcorn Party
Creating Scatter Plots
Interpreting Stem and Leaf Plots
Predicting Population Trends Based on a Sample Population
Finding the Interquartile Range
Interpreting Two-Way Tables
Sonraki
Interpreting Bar Graphs
Yeni Kaynaklar
Mondrian's Puzzle
Untitled
Rolling Circles and Polygons
seo tool
רישום חופשי
Kaynakları Keşfet
Fr Trig Functions
To find the point of intersection and angle between line and plane
copy of bisecting an angle
test sin
Garis & 2 Titik
Konuları Keşfet
Hiperbol
3D (Üç-Boyutlu) Vektörler
Küp
Üstel Fonksiyonlar
Parametrik Eğriler