Sign in
Search
GeoGebra
Home
Resources
Profile
Classroom
App Downloads
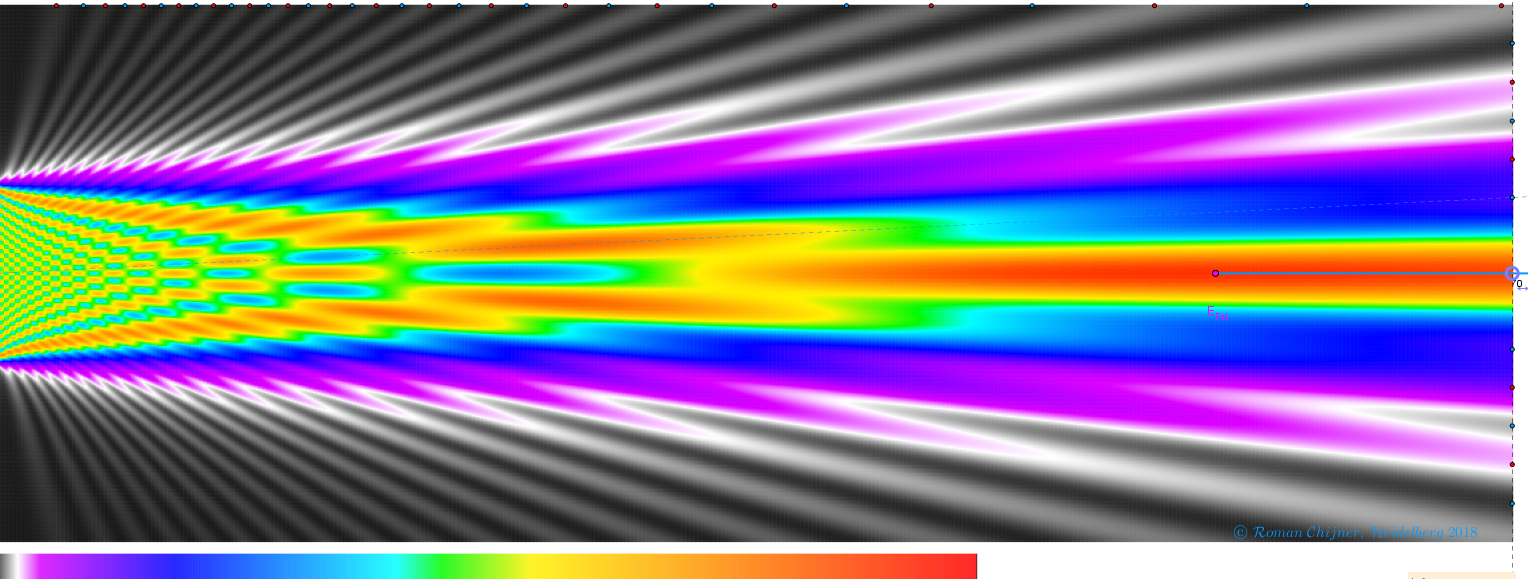
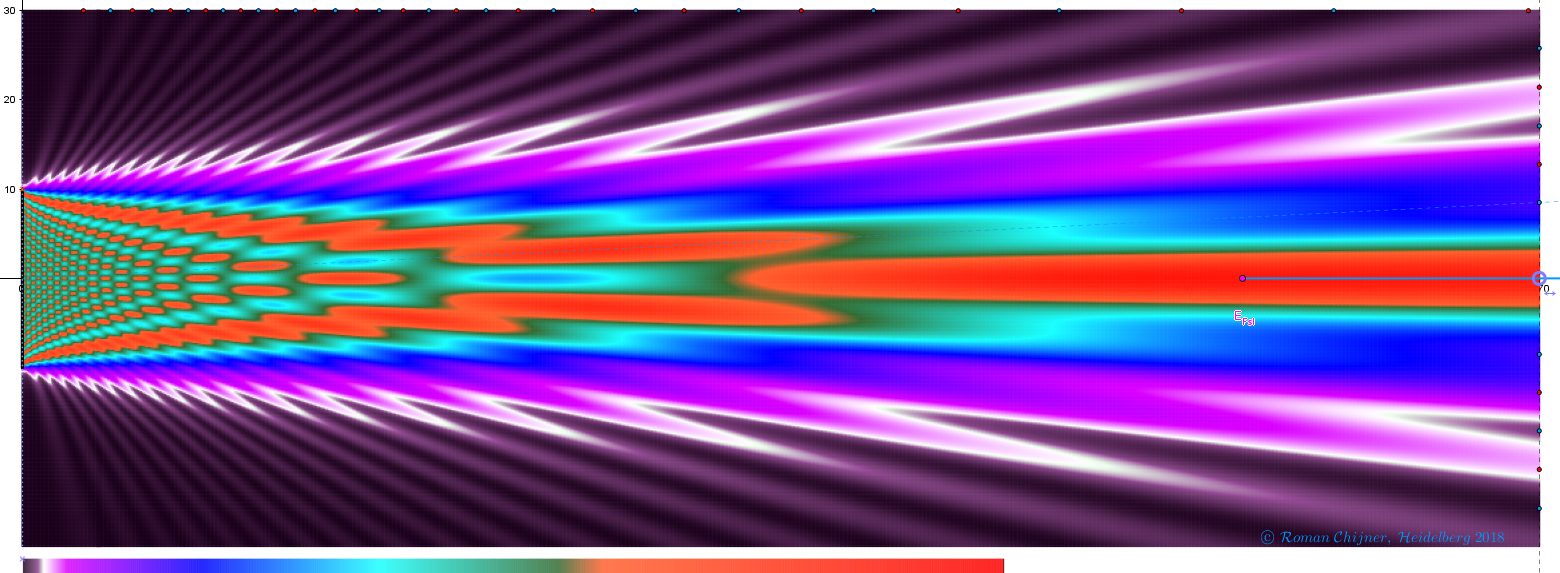
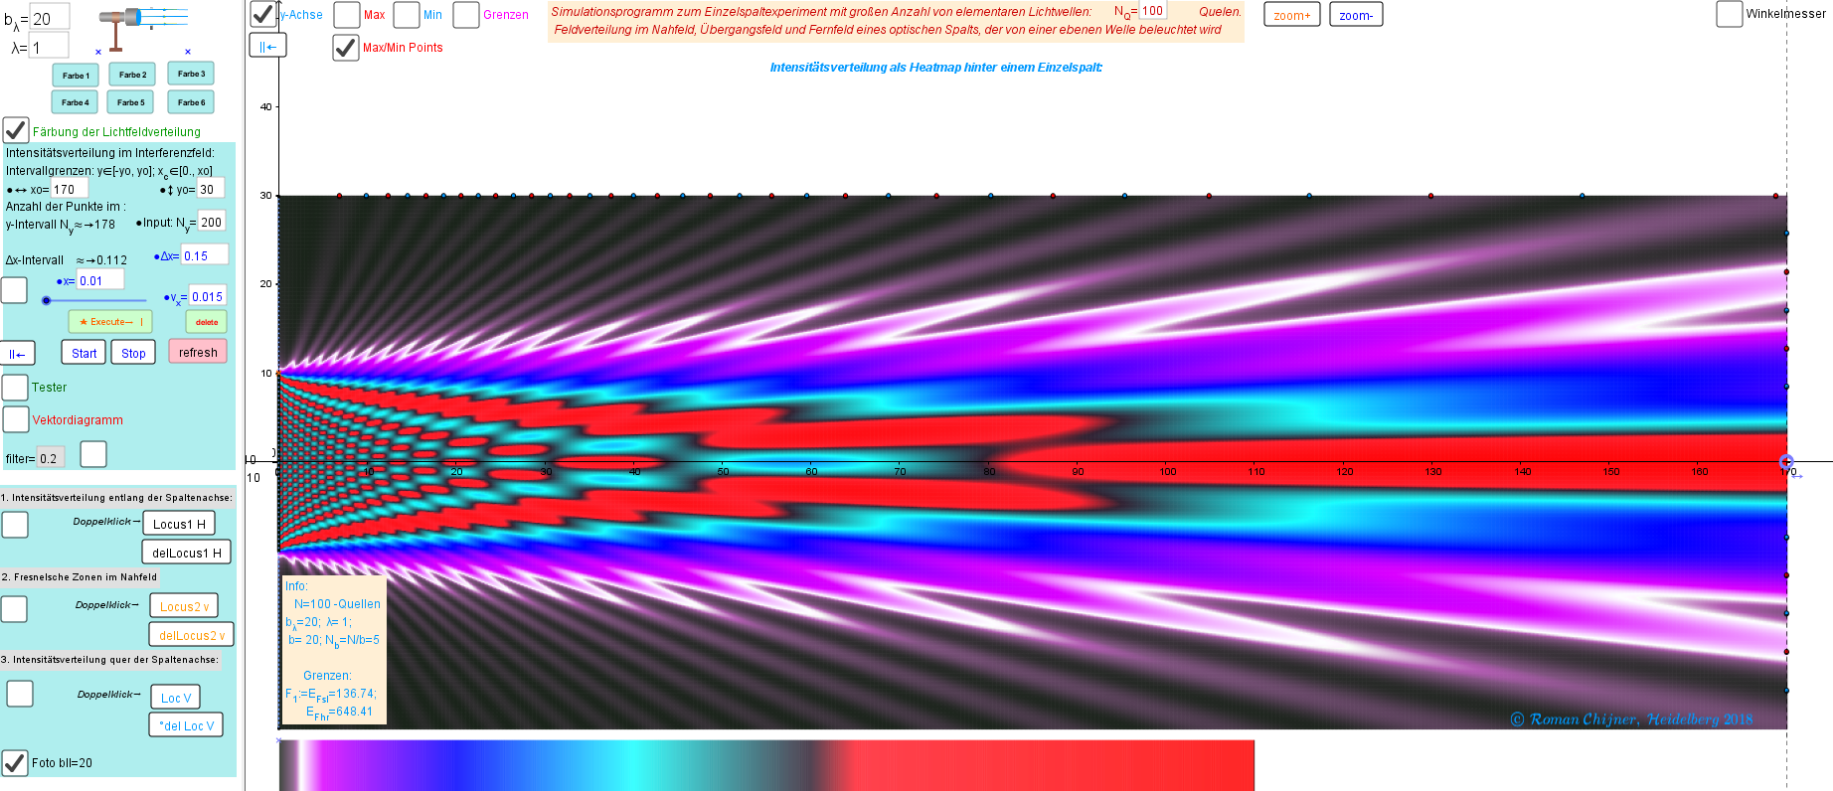
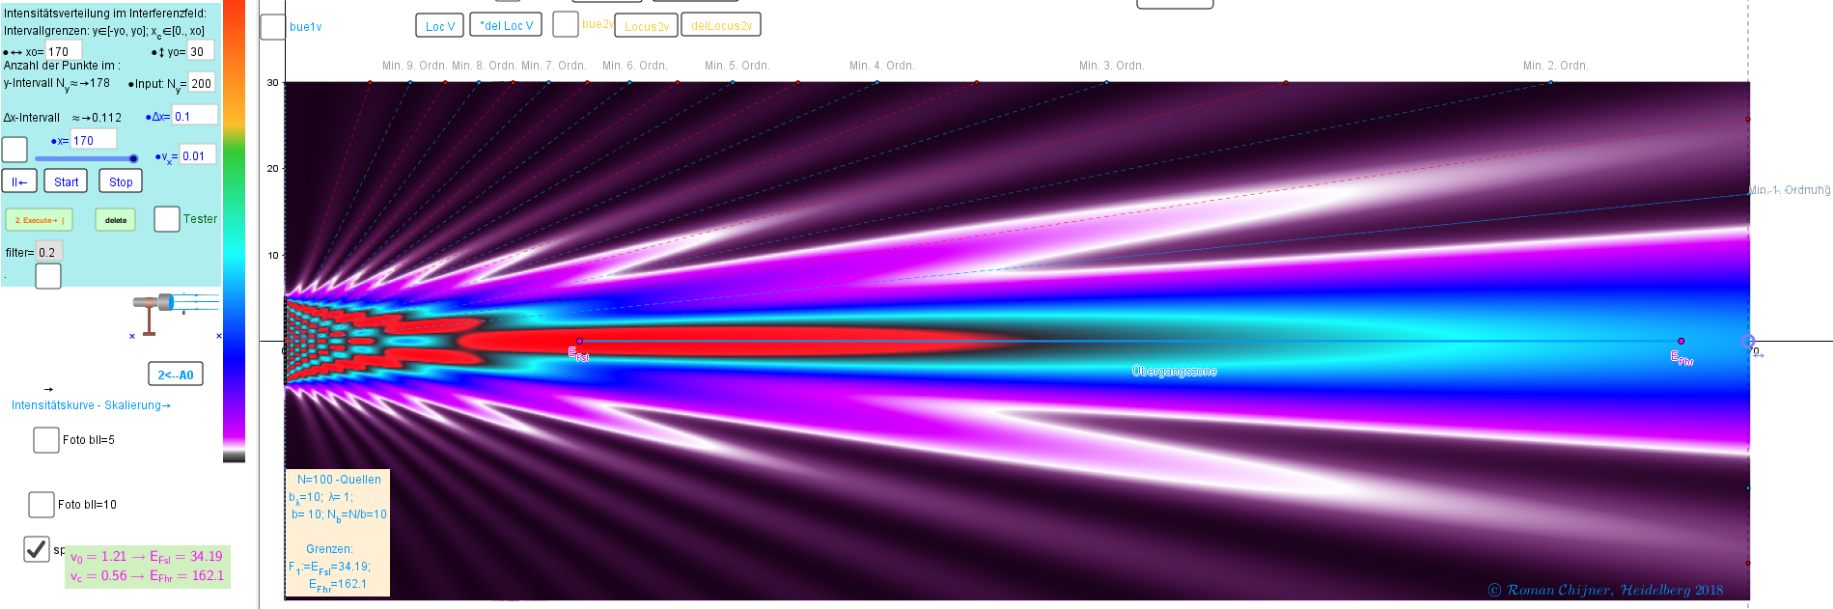
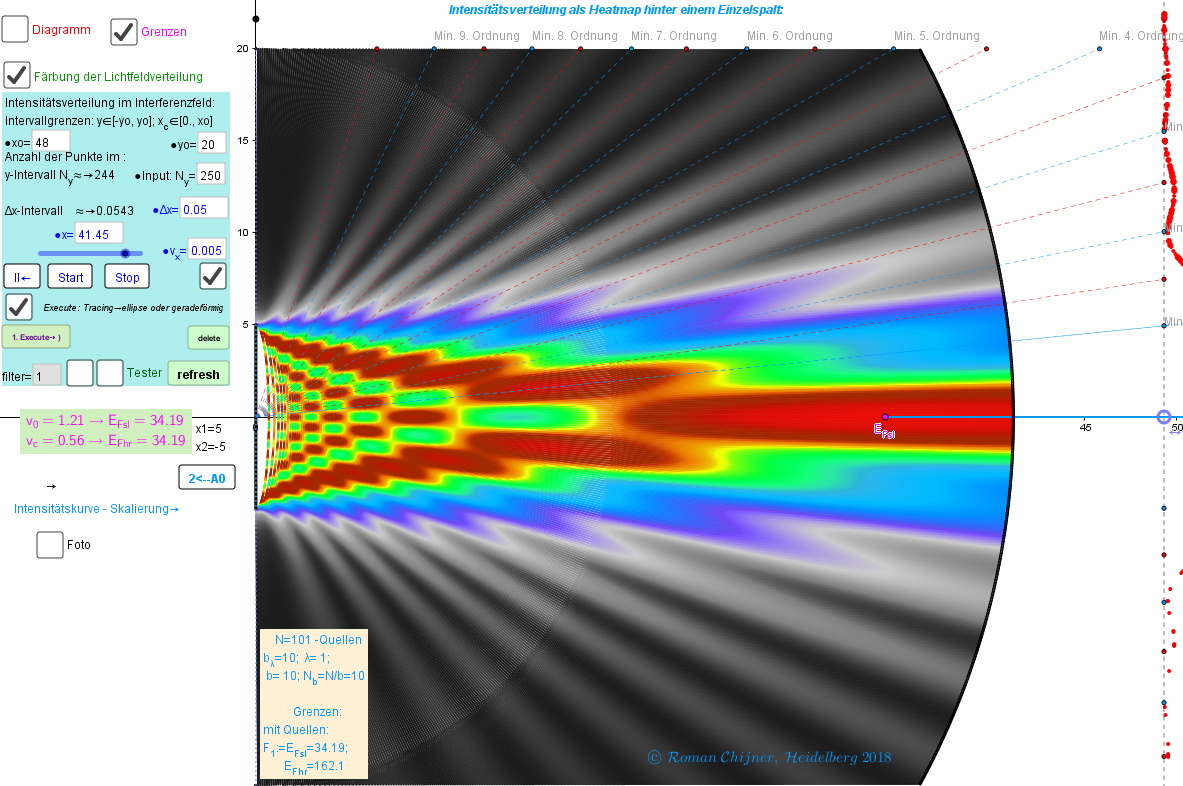
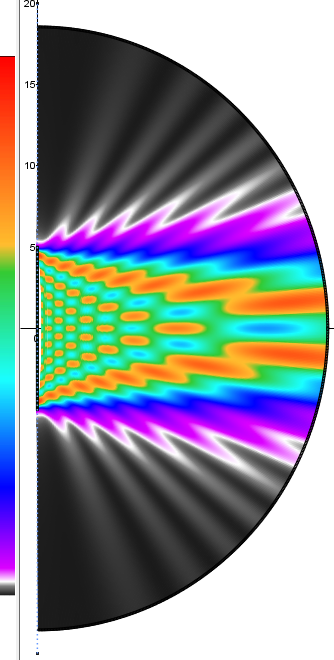
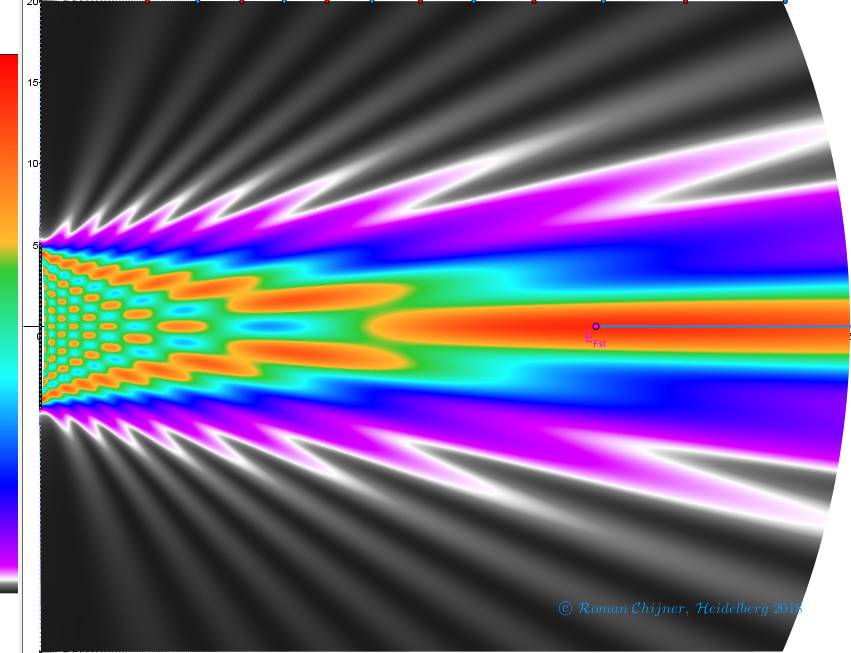
Bilder₂ zum Applet ●Heatmap hinter einem Einzelspalt, die als System von Punktquellen gedämpfter Wellen dargestellt wird.
Author:
Roman Chijner
Applet:
https://www.geogebra.org/m/dqyhaarg
b_λ=20, Farbe 6, N_Q=200
b_λ=20, Farbe 3, N_Q=200
b_λ=20, Farbe 2, N_Q=200
b_λ=10, Farbe 3, N_Q=200
b_λ=10, Farbe 1, N_Q=100
New Resources
Function art 3D - waiting shed
Perpendicular Lines: Quick Exploration
Laundry Basket
Linear Combination of Vectors
Function art 3D - waiting shed (v2)
Discover Resources
Lesson 3-3
Sum And Difference of 2 Cubes
Domain and Range of a Quadratic
Harmonic Addition 1
GeoGebra Augmented Reality: Egg Modeling
Discover Topics
Multiplication
Linear Equations
Natural Numbers
Integral Calculus
Median Value